You’ve probably come across the saying, “You can’t manage what you can’t measure”. A popular mantra in the business world, it underscores the importance of data for effective running and continuous improvement of business operations. Without keeping track of key metrics, it’s hard to know what to improve or if you’re making any progress towards your goals.
In software engineering, monitoring and observability play a similar role, allowing us to gather essential data about a system’s performance, health, and behavior so that we can guarantee reliability while improving our operations.
Modern software systems are expected to handle thousands, sometimes millions of user requests per day with minimal downtime. Achieving this level of reliability requires deep visibility into system performance so we can proactively detect issues, pinpoint bottlenecks, and leverage data-driven insights to optimize our operations.
In this note, we’ll take a close look at monitoring and observability—exploring the key components, tools, implementation strategies, and best practices.
Understanding the Basics
Monitoring focuses on detection and proactive issue management, while observability provides deeper insights into the root causes and mechanisms behind those issues. Both concepts are grounded in Control Theory, which uses feedback to steer systems toward desired outcomes. Let’s clarify both terms:
- Monitoring involves collecting, analyzing, visualizing, and using data to track the performance and health of systems and infrastructure. It is a systematic and ongoing process for detecting issues and maintaining smooth operations.
- Observability refers to how well we can understand a system’s internal state based on its external outputs. It takes a broader, more proactive approach than traditional monitoring, emphasizing the ability to diagnose and comprehend complex system behaviors.
Monitoring and observability work hand in hand—monitoring provides the essential foundation, while observability helps uncover deeper insights to understand and resolve issues more effectively.
The Importance of Monitoring and Observability
Let’s take a moment to appreciate why these two concepts are relevant:
Enhanced System Reliability
Due to proactive issue detection, we are in a better position to recognize issues before they occur or escalate. This allows us to maintain reliable systems that serve user requests. We also enjoy reduced downtime, because we’re more proactive than reactive.
Faster Incident Response
We can quickly identify bottlenecks in our system as well as areas of fault. This allows us to drill down quickly to the root cause of problems and render quick diagnoses because our troubleshooting is much more efficient.
Improved Performance Optimization
Because we have better visibility into the system, we can tune and optimize our system’s performance to achieve the best results. We can also tell when resources are under-utilized; this allows us to make improvements to our architecture to drive better utilization of resources for optimal results.
Better User Experience
At the end of the day, we engineer systems to serve user requests. When systems are more reliable, this translates to better service availability and overall user experience. Engineering is such an integral part of product execution; more often than not, engineering reliable systems translates to a happy customer experience.
Informed Decision Making
An added benefit of observability is we are now in a position to make informed architectural decisions with data-driven insights. We can also observe and analyze trends in our system usage.
Key Components of Observability
Now that we have convinced ourselves of the relevance of monitoring and observability, the next question is what are the key components to address when we embark on this journey:
- Metrics
- Traces
- Logs
- Events
Let’s look at them one by one.
Metrics
Metrics provide quantitative insights into performance and health. They are numerical data points that represent specific aspects of a system’s performance over time. Metrics are typically collected as time-series data that can be aggregated over a period. There are different types of Metrics:
System Metrics
- CPU Usage: Percentage of CPU capacity being utilized.
- Memory Consumption: Amount of RAM being used by processes or services.
- Disk I/O: Read and write operations per second.
- Network Throughput: Data transfer rates over network interfaces.
Application Metrics
- Request Rate (Throughput): Number of requests handled per unit of time.
- Error Rate: Percentage of failed requests or operations.
- Latency: Time taken to process a request or operation.
- Concurrency: Number of simultaneous operations or users.
Business Metrics
- Transaction Volume: Number of transactions processed.
- Revenue per User: Average revenue generated per user.
- Conversion Rates: Percentage of users completing desired actions.
Each of these metrics delivers key insights into the performance, behavior, and overall health of our system. This helps us make data-driven decisions in our engineering. For example, if we have persistent high CPU usage, we can tell that our system is maxing out on CPU and we need to optimize our operations to use less CPU or perhaps we need to scale our compute.
Traces
A trace is the end-to-end journey of a request as it travels through various services and components within a system. A trace tells a story of how a request was processed from start to finish. Typically, a trace consists of multiple spans.
A span is a unit of work within a trace that has a definite start and end.
Traces allow us to identify bottlenecks and let us know where a request spent the most time in its processing.
Let’s look at a scenario where a user makes a request to an e-commerce website to purchase an item.
The trace represents the entire purchase process from the user’s initial request to the final confirmation.
We can identify a few spans in the trace:
- User Service: Receives the purchase request.
- Inventory Service: Checks item availability.
- Payment Service: Processes the payment.
- Notification Service: Sends a confirmation email to the user.
Each of these operations is a span within the overarching trace of the purchase request. A trace might tell us that we spent most of the time in Payment Service because processing payment takes the longest time while servicing the request.

Logs
Logs provide a record of events, actions, or important information that enables developers to diagnose issues. They are timestamped documentation of facts that give us visibility into what is happening in our system.
There are different types of Logs:
- Application Logs:
- Generated by applications to record operational events, such as user actions, business transactions, and application-specific messages.
- Generated by applications to record operational events, such as user actions, business transactions, and application-specific messages.
- System Logs:
- Produced by the operating system to document system-level events, including hardware changes, system errors, and security events.
- Produced by the operating system to document system-level events, including hardware changes, system errors, and security events.
- Security Logs:
- Capture security-related events like authentication attempts, access control violations, and intrusion detection alerts.
- Capture security-related events like authentication attempts, access control violations, and intrusion detection alerts.
- Audit Logs:
- Maintain a record of system and user activities for compliance and auditing purposes, ensuring traceability of actions.
- Maintain a record of system and user activities for compliance and auditing purposes, ensuring traceability of actions.
- Event Logs:
- General logs that record significant events within the system, which may include both informational and error messages.
Log types can have different levels of severity. Severity allows us to categorize logs according to their relevance or the amount of attention they require. FATAL, ERROR, TRACE, DEBUG, and INFO are some examples of log levels that applications can use to categorize logs according to their severity. With this, developers can filter for specific log levels in the course of their inquiry into system behavior.
Events
Events are discrete occurrences of interest within a system. They help us identify when something of interest has happened in the system. Events are usually timestamped, providing contextual information (metadata) that helps understand the event.
There are different types of events:
- System-level Events:
- System boot, shutdown, service restarts, hardware failures.
- System boot, shutdown, service restarts, hardware failures.
- Application level Events:
- User logins, data processing completions, feature toggles, and configuration changes.
- User logins, data processing completions, feature toggles, and configuration changes.
- Security level Events:
- Authentication attempts, access control changes, and intrusion detection alerts.
- Authentication attempts, access control changes, and intrusion detection alerts.
- Operational Events:
- Deployment of new code, scaling of services, and scheduled maintenance.
- Deployment of new code, scaling of services, and scheduled maintenance.
- Business Events:
- Transaction completions, order placements, subscription renewals.
- Transaction completions, order placements, subscription renewals.
- Performance Events:
- Spike in response times, resource utilization thresholds being crossed.
Events can be collected in different ways: via logs, dedicated event streams, or code instrumentation.
Monitoring and Observability Tools
Now that we have some understanding of Monitoring and Observability, including the key components. Let’s get familiar with some of the tools that enable us to monitor and observe our system.

Popular Monitoring Tools
- Prometheus: An open-source toolkit for monitoring and alerting. Prometheus collects real-time data in a time series and provides a query language (PromQL) to query and extract insights from the metrics data. You can learn more about Prometheus in the official docs.
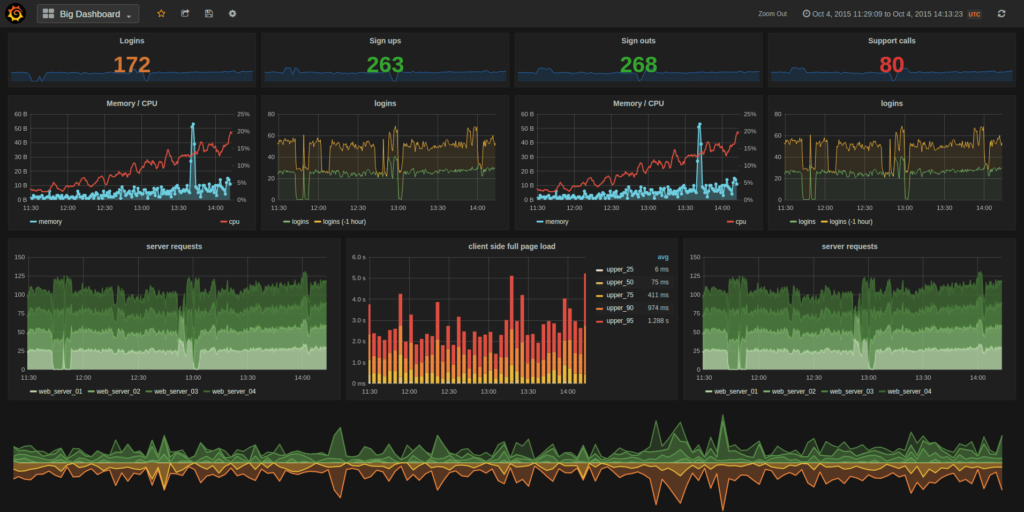
- Grafana: An open-source tool for visualizing and analyzing metrics, logs, and trace data. Graphana includes plugins for different data sources including Prometheus, ElasticSearch, and many others. You can learn more about Graphana in the official docs.
Observability Platforms
- Splunk: A platform that specializes in collecting, indexing, and analyzing machine-generated data produced by applications, devices, and other digital sources. Splunk is Renowned for its ability to handle vast amounts of data from diverse sources, transforming raw data into actionable insights, and enabling organizations to enhance operational intelligence, security posture, and business performance. You can learn more in the official docs.
- New Relic: An observability platform that offers a suite of tools for monitoring, visualizing, and optimizing the performance of systems and infrastructure. New Relic provides features like Application Performance Monitoring (APM), Logs Management, Dashboard, and Visualisation. Find out more on the official website.
- Elastic Observability: A part of the Elastic Stack that integrates various observability data sources—logs, metrics, and traces—into a single, cohesive platform. By leveraging Elasticsearch for data storage and Kibana for visualization. Elastic Observability provides users with powerful tools to monitor system performance, troubleshoot issues, and optimize application behavior in real-time. Learn more.
Log Management Solutions
- ELK Stack (Elasticsearch, Logstash, Kibana): The ELK Stack is a powerful, open-source suite of tools designed to facilitate efficient log management, searching, visualization, and analysis. Comprising Elasticsearch, Logstash, and Kibana, the ELK Stack provides a unified platform for collecting, processing, storing, and visualizing log data from various sources. Learn more.
- Fluentd: A versatile, open-source data collector designed to unify the collection, processing, and distribution of data, particularly log data, across various systems and applications. Developed under the umbrella of the Cloud Native Computing Foundation (CNCF). Learn more.
Distributed Tracing Tools
- Jaeger: An open-source distributed tracing system initially developed by Uber Technologies and now a part of the Cloud Native Computing Foundation (CNCF). Jaeger is an end-to-end distributed tracing system that helps organizations monitor and optimize the performance of their microservice-based applications. By capturing detailed traces of individual requests as they propagate through different services. You can learn more here.
- Zipkin: An open-source distributed tracing system designed to facilitate the collection, storage, and visualization of trace data. It helps in tracing requests, performance monitoring, root cause analysis, service dependency mapping, and more. You can read more about it in the official docs.
Implementing Monitoring and Observability
This section of the note covers the process for implementing effective monitoring and observability in your system. With the advent of microservices and distributed systems, software systems have become more complex. Amidst the complexity, we must ensure reliability and operational efficiency. Let’s dive into some of the key elements of an effective monitoring and observability strategy.
Set Up Metrics Collection
One of the first things you want to do is identify the key metrics to collect. Remember, earlier in this note we touched on System Metrics, Application Metrics, and Business Metrics. You will need to identify the metrics that are relevant to your context. The next question is: how do you identify the relevant metrics?
Understand your Business and Technical Goals. What is important to you on a technical level? Is uptime critical to your business? Optimize for the ability to improve performance, troubleshoot, plan, and guarantee the security and stability of your system.
Identify Critical components. Which components are most essential for delivering value and need closer monitoring?
What KPIs are relevant to you? response times, throughput, latency, resource utilization (CPU, memory, disk I/O), uptime, error rates, mean time between failures (MTBF), page load times, user satisfaction scores, and number of unauthorized access attempts. These are a few KPIs that can give you a comprehensive pulse of your entire system.
Prioritize actionable metrics. Pay more attention to metrics that can lead to specific actions and avoid metrics that don’t provide clear value. This will help increase our Signal-to-Noise ratio.
Use standard libraries and tools – much better than building your own tools from scratch.
Adopt Effective Logging Strategies
Implement structured logging with appropriate log levels to ensure that logs are informative and manageable.
Common Log Levels:
- DEBUG: Detailed information for diagnosing issues during development.
- INFO: General operational information about the application’s normal behavior.
- WARN: Indicators of potential issues that do not currently affect functionality.
- ERROR: Errors that affect functionality and require immediate attention.
- FATAL: Severe errors that lead to application termination.
Avoid Logging Sensitive Information. This includes passwords and personal information. You can also use masks to hide sensitive data.
Use descriptive messages that will aid in quickly identifying issues.
Handle logs securely. Encrypt logs in transit and at rest to protect against unauthorized access.
Monitor Log Health, to be sure you’re not missing logs and the logging infrastructure is functioning correctly.
Manage Log Storage by using strategies like Log Rotation. This will help prevent exhaustion of storage. You might also want to avoid logging at a very verbose level unless you’re debugging and need verbosity.
If you’re using a Cloud Provider, in many cases you won’t have to bother too much about implementing the above strategies yourself. However, Cloud Providers provide a foundation and oftentimes require you to tweak or customize the defaults to suit your needs. Hence it pays to have a good grasp of how to imbibe effective logging strategies.
Implement Distributed Tracing
Especially if you have requests that span multiple services. It helps to be able to trace the entire life cycle of a request even across service boundaries. This is where we do Trace Context Propagation – passing trace identifiers across service boundaries to maintain the continuity of the request journey.
As much as possible, you should automate this context propagation, so the logic is not liable to errors in implementation. Leverage existing libraries or frameworks.
Use Sampling Techniques to manage the volume of trace data. This can serve storage costs or performance concerns. In very high-traffic systems, the volume of trace data can be very high. Sampling makes a tracing system scalable and manageable.
Be sure you have a tool or dashboard that allows you to visualize traces. Visualizing helps to quickly grasp information and make decisions.
Setup Automated Alerts
Pay attention to critical metrics like CPU or RAM usage. It is important to set up automated alerts to warn when thresholds are exceeded. You can also use machine learning algorithms to identify unusual patterns or anomalies.
Alerts should be dispatched to the parties responsible for the reported issue. Ensure you have clearly defined protocols for escalating and resolving different alert types. This will make the process smoother.
Automated alerts enable reduced issue response time and quick resolution.
Manage monitoring configuration with code that flows through CI.
How to Choose the Right Stack
A good approach will be to consider what is important to you. Understand your Business and Technical Goals.
You can also experiment with different tools and set up tests to get a feel of how the tools work. Ease of use, Reliability, and Scalability are some of the primary concerns to keep at the back of your mind when making your choices. The technology stack should be able to scale with the business.
Foster a Culture of Observability
When setting up observability, you reap the best results when your teams do not work in silos. In essence, there should be knowledge sharing across teams. Synchronization of efforts and sharing of infrastructure and tooling. This creates a collaborative mindset, one that will yield greater results for the organization.
And while at it, practice continuous improvement. Regularly review processes and systems for optimizations and improvements. Adapt your observability as the system’s architecture evolves.
Future Trends in Monitoring and Observability
AI and Machine Learning are revolutionizing software development and this applies to monitoring and observability. Using AI, we can achieve more intelligent and proactive monitoring systems.
Predictive analytics involves using statistical inference on historical data to forecast future events. This means anticipating potential system failures, performance degradation, or security breaches.
Another use for ML is Automated anomaly detection which helps to quickly detect and respond to deviations from regular system behaviour.
OpenTelemetry as an industry standard provides a unified set of APIs, SDKs, and tools for instrumenting applications, making it easier to collect and export telemetry data consistently across different platforms and services. Telemetry data comprises metrics, traces, and logs.
OpenTelemetry data format is standard and interoperable, facilitating integration with diverse monitoring tools. This encourages collaboration and community development.
You can learn more about OpenTelemetry on this link .
Greater Emphasis on User Experience Monitoring
As applications become more user-centric, monitoring and observability practices are increasingly focusing on the end-user experience. Understanding how users interact with applications provides valuable insights for improving product quality.
This creates a feedback loop where the insights we get from user interaction data are incorporated into the development of the product.
Conclusion
This note turned out to be more extensive than I initially anticipated. As we delve deeper into monitoring and observability, it becomes increasingly clear just how vital these concepts are in software development. We cannot fully optimize what we cannot measure, and to optimise our performance and reliability, we must implement effective observability practices. By equipping ourselves with the right tools and adopting a robust observability philosophy, we can ensure the reliability of our systems and ultimately create experiences that delight our end users.
In my next note on this topic, I will take a hands-on approach by setting up a comprehensive monitoring and observability stack for a Rust application using Jaeger, Prometheus, and Grafana. This practical application will help solidify our understanding.